These maps and fact sheets summarize global precipitation patterns associated with major global and regional climate modes.
This page features Famine Early Warning Systems Network (FEWS NET) fact sheets and maps that show typical precipitation outcomes during both phases of the El Niño-Southern Oscillation (El Niño and La Niña) and the Indian Ocean Dipole.
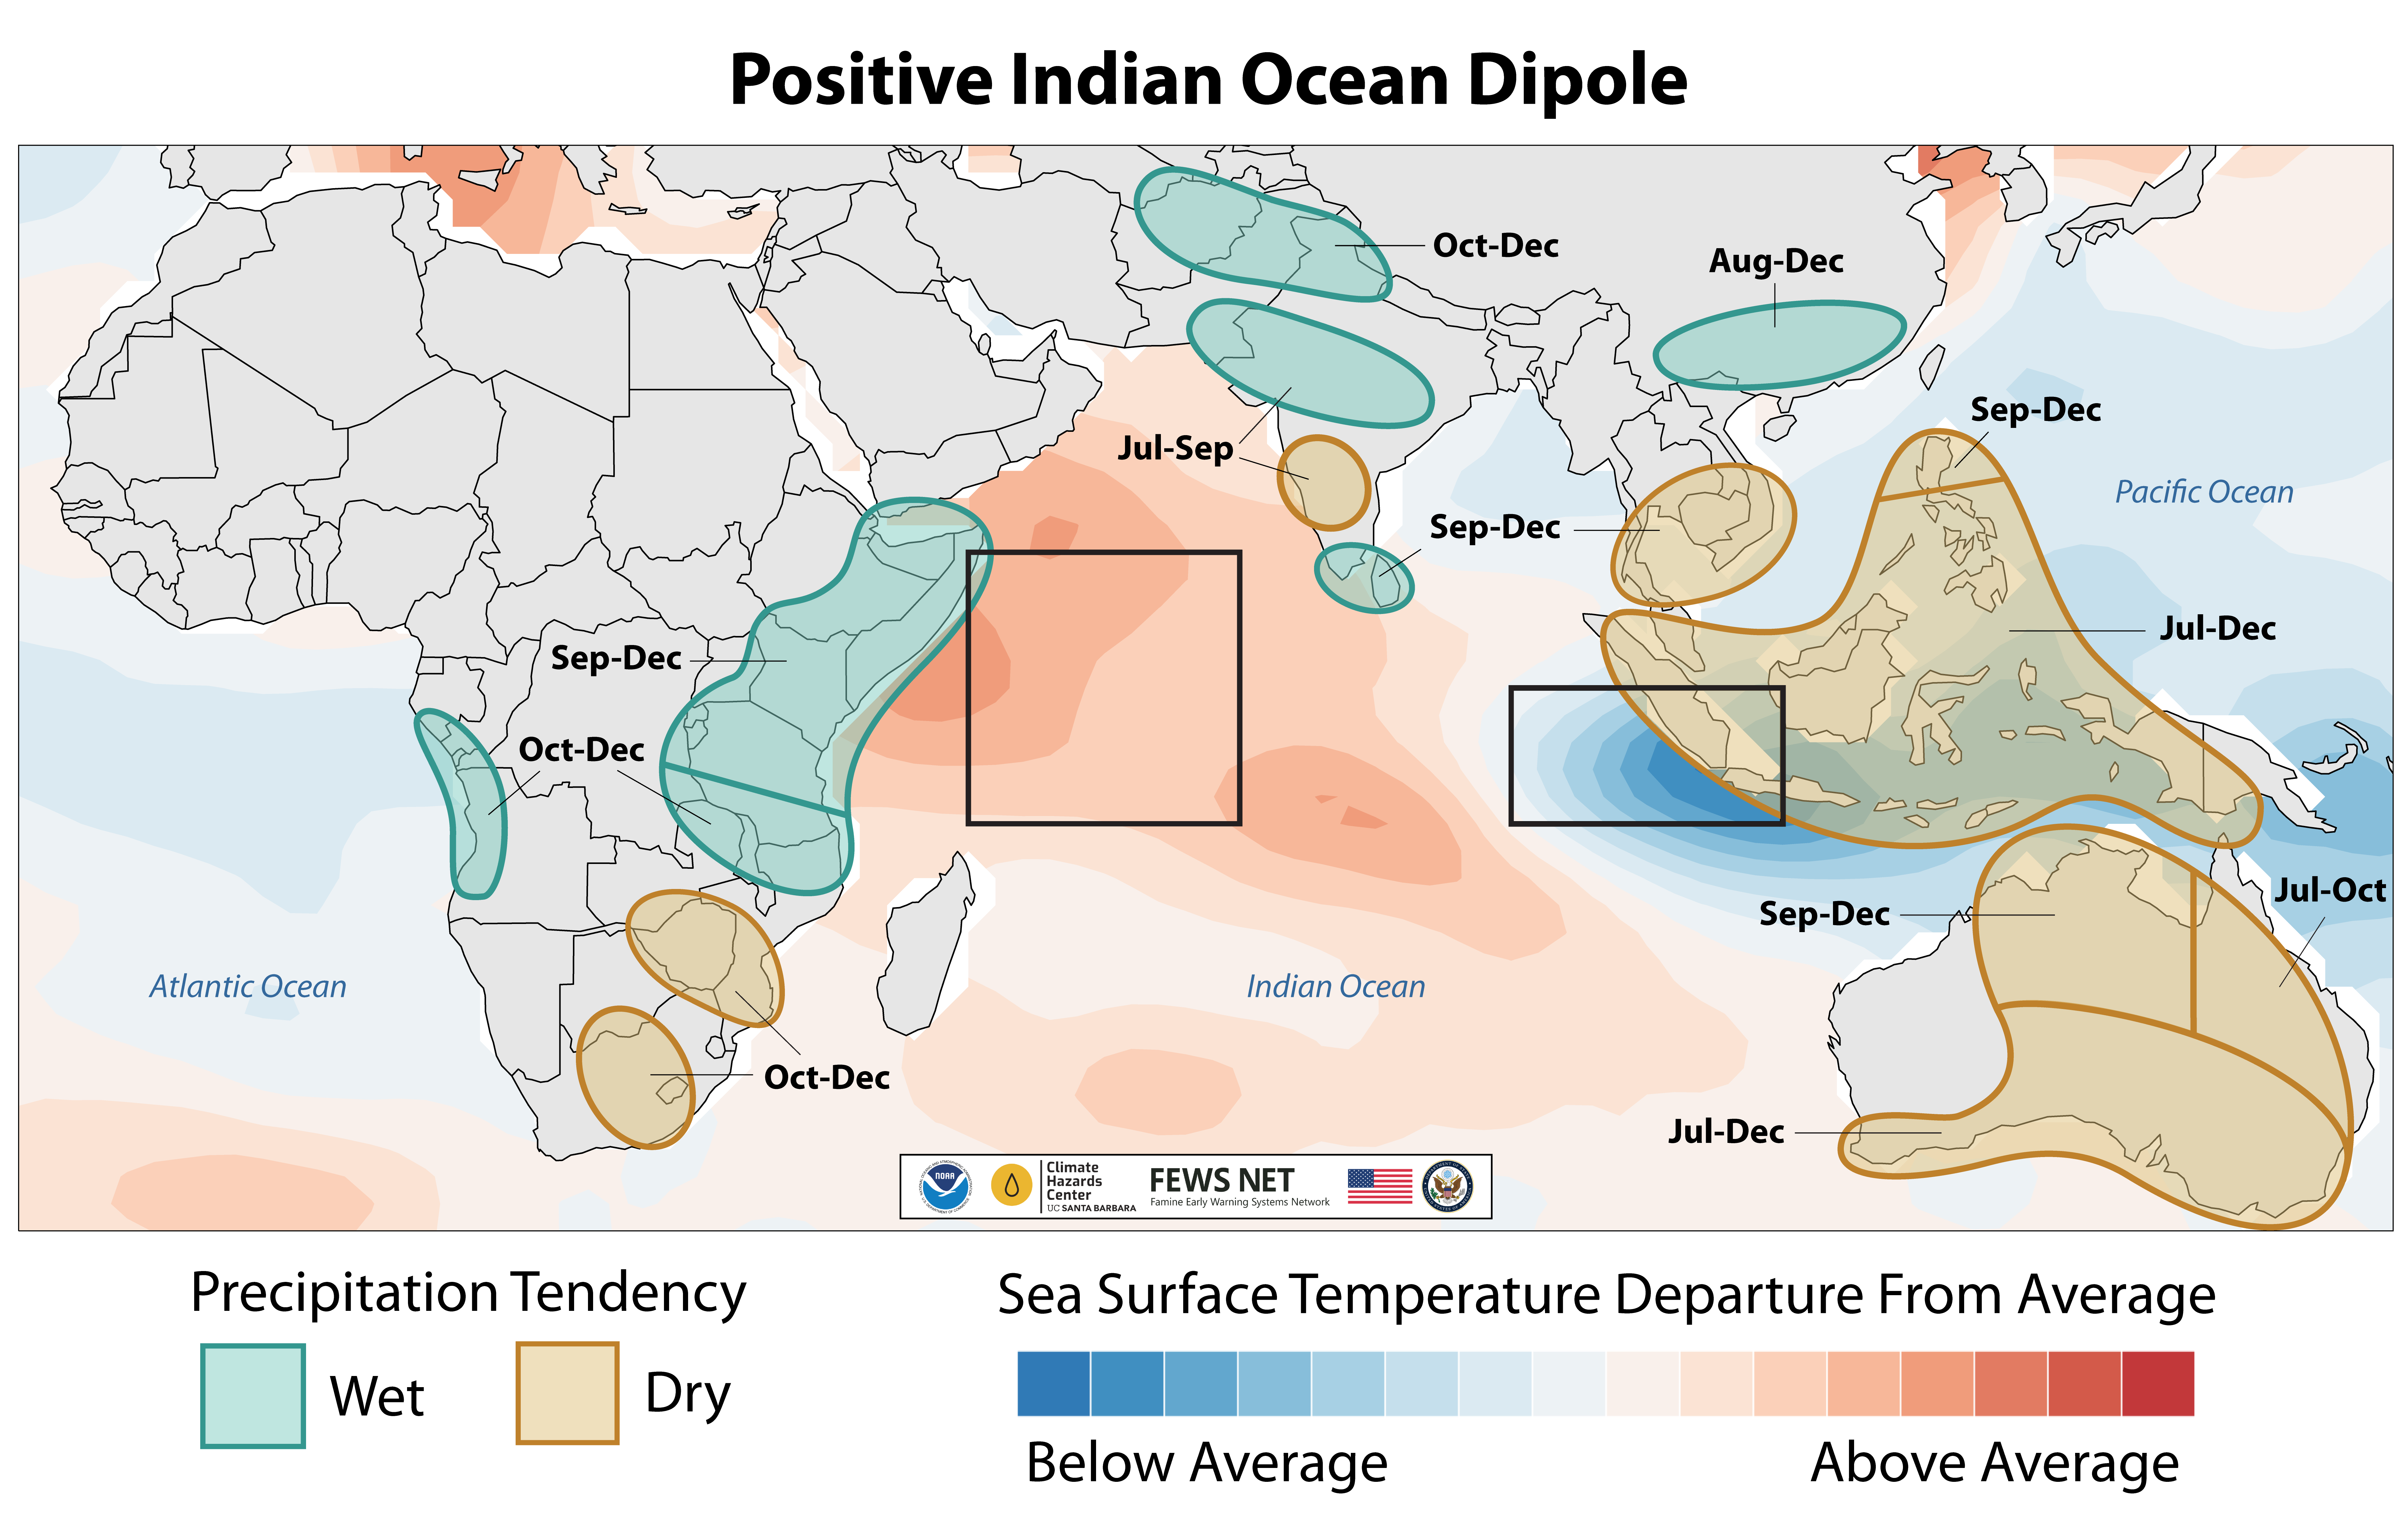
The precipitation patterns illustrated in these maps are based on analysis of historical CHIRPS data and additional datasets. These identify the timing and locations of above-average (shown in green) and below-average (shown in tan) precipitation that are associated with each climate mode.
While precipitation outcomes differ from one event to the next, consistent patterns across past events provide a baseline for prediction. Historical impacts during these modes, their observed and predicted strength and duration, and other regional factors, are often used in the development of agroclimatic outlooks.
| El Niño and Precipitation | |
|---|---|
 |
 |
| La Niña and Precipitation | |
|---|---|
 |
 |
| Positive Indian Ocean Dipole and Precipitation | |
|---|---|
 |
 |
| Negative Indian Ocean Dipole and Precipitation | |
|---|---|
| |
 |