Two studies validating CONUS (McEvoy et al. 2016) and global (Shukla et al. 2017) reference evapotranspiration (ET0) for drought forecasting provide a baseline for the generation of a real-time forecast product. Both studies show that ET0 typically provides greater skill than precipitation forecasts, and significant skill exists in major agricultural regions. Note that these are non-official and experimental forecast products.
Data: Climate Forecast System version 2 (CFSv2; Saha et al. 2014) monthly mean forecasts: ftp://nomads.ncdc.noaa.gov/modeldata/cfsv2_forecast_mm_9mon/
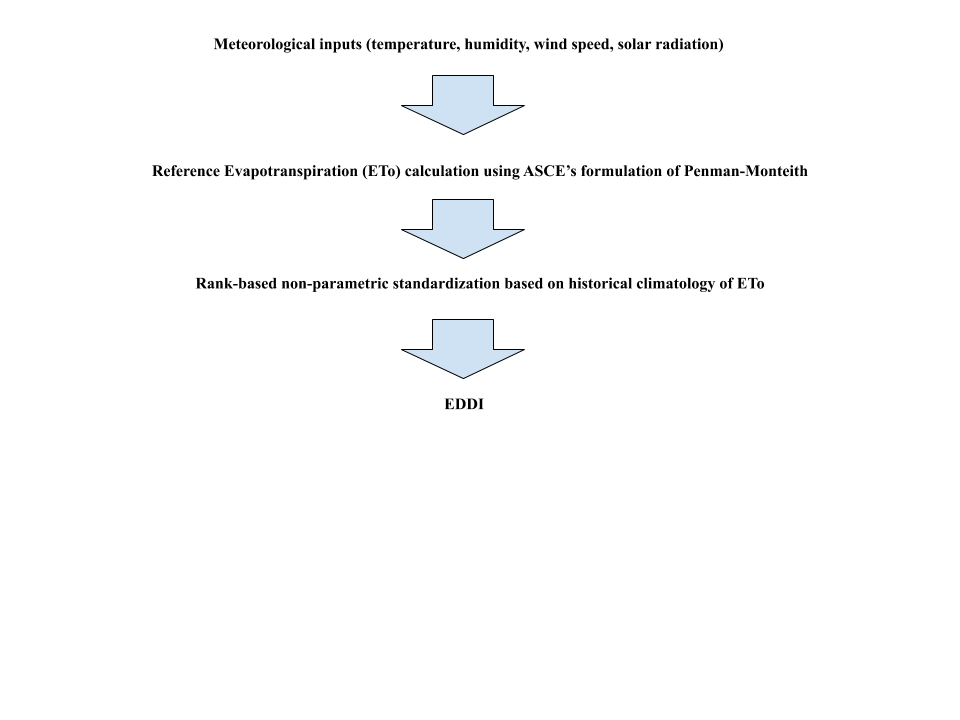
EDDI forecasts: The Evaporative Demand Drought Index (EDDI; Hobbins et al. 2016, McEvoy et al. 2016) is computed following the methods of Hobbins et al. (2016). In brief, first monthly ET0 (Allen et al. 2005) is computed from CFSv2 temperature at 2 m, wind speed at 10 m (scaled to 2 m), specific humidity at 2m, and downward shortwave radiation at the surface. Each month, an ensemble of ETo forecasts is created using forecasts of meteorological inputs (mentioned above) initialized every five days and four times per day to create 24-28 member ensembles. For example, the September ensemble consists of forecasts initialized on 09/03, 09/08, 09/13, 09/18, 09/23, and 09/28 four times per day (00Z, 06Z, 12Z, and 18Z) for a 24-member ensemble. The initialization dates are consistent with the CFSv2 reforecast initial days, which is used as the baseline data. A synthetic ET0 distribution is created from CFSv2 reforecast data (1982-2009) to compute EDDI. For example, September initialized CFSv2 reforecasts contain 28 years and 24 members per September giving a total of 672 values per lead time. The real-time forecast ET0 is then used to extend the distribution and compute EDDI with a base period of 1982-2009 and lead times of 1-6 months.
Reference evapotranspiration probability forecasts: Using the same method used to create the EDDI forecasts, the CFSv2 reforecasts are used to compute historical tercile values (33% and 66%) to set breaks for below normal, near normal, and above normal ET0. Each member of the real time forecast ensemble is then group into one of three categories and the probability of each is computed. For example, given a 24-member ensemble, 18 members are forecast to be above normal (75%), 4 members are forecast to be near normal (17%), and 2 members are forecast to be below normal (8%). The highest probability (in this case 75% for above normal) is then plotted for each grid point.
Key features of EDDI:
- Based on solely on evaporative demand
- Early indicator of drought
- Routinely available each month for the next 6 months
- Global and at a spatial resolution of 1 X 1 degree
How is EDDI calculated?
Citations
Allen, R. G., I. A. Walter, R. Elliott, T. Howell, D. Itenfisu, and M. Jensen (2005), The ASCE standardized reference evapotranspiration equation, Rep. 0-7844-0805-X, 59 pp. [Available at http://www.kimberly.uidaho.edu/water/asceewri/ascestzdetmain2005.pdf.]
Hobbins, M., Wood, A., McEvoy, D. J., Huntington, J. L., Morton, C. G., Verdin, J., Anderson, M., Hain, C. (2016). The Evaporative Demand Drought Index: Part I - Linking Drought Evolution to Variations in Evaporative Demand, J. Hydrometeor., 17, 1745-1761, DOI: 10.1175/JHM-D-15-0121.1
McEvoy, D. J., Huntington, J. L., Mejia, J. F., Hobbins, M. (2016). Improved seasonal drought forecasts using reference evapotranspiration anomalies, Geophys. Res. Lett., 43, (1), 377-385, DOI: 10.1002/2015GL067009
McEvoy, D. J., Huntington, J. L., Hobbins, M., Wood, A., Morton, C. G., Verdin, J., Anderson, M., Hain, C. (2016). The Evaporative Demand Drought Index: Part II -- CONUS-wide Assessment Against Common Drought Indicators, J. Hydrometeor., 17, 1763-1799, DOI: 10.1175/JHM-D-15-0122.1
Saha, S., et al. (2014), The NCEP Climate Forecast System Version 2, J. Clim., 27, 2185–2208, DOI:10.1175/JCLI-D-12-00823.1
Shukla, S., McEvoy, D. J., Hobbins, M., Husak, G., Huntington, J. L., Funk, C., Macharia, D., Verdin, J. (2017). Examining the value of global seasonal reference evapotranspiration forecasts to support FEWS NET's food insecurity outlooks, Journal of Applied Meteorology and Climatology, 56, (11), 2941-2949, https://doi.org/10.1175/JAMC-D-17-0104.1