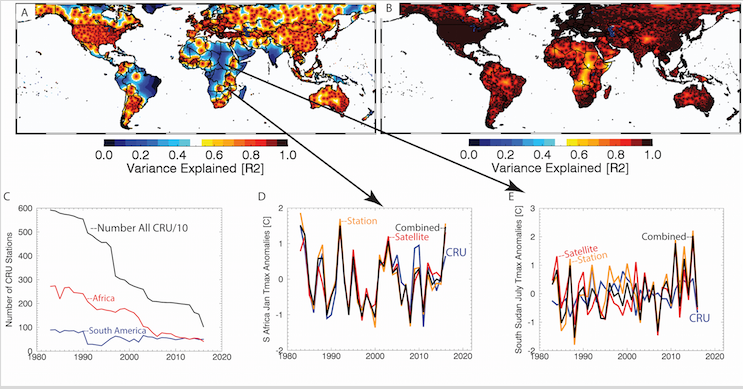
Since the origin of modern climate science in the nineteenth century, accurate data have been fundamental to advancing our understanding of the dynamics and physics of climate. In a rapidly warming world, the need for accurate data is swiftly increasing. For example, while there is an expectation that human-induced warming will likely exacerbate the impacts of rainfall deficits, data support for such evaluations is sparse. Understanding the extent of changes in climate extremes, as well as their dynamics and physics, is a critical challenge for twenty-first-century climate science, yet our ability to globally monitor temperature variations is limited and, in fact, declining. For example, between 1983 and 2016, the number of in situ observations at the University of East Anglia Climatic Research Unit (CRU) Tmax product declined precipitously (5,900→1,000); 1,000 poorly distributed measurements are insufficient to resolve regional Tmax variations.
Given the lack of in situ observation reports, the CHC has developed a long-term monthly mean Tmax climate data record by combining long (1983 to 2016), high-resolution (0.05°), cloud-screened archives of geostationary satellite thermal infrared (TIR) observations with a dense set of ~15,000 in situ station observations. The results (Fig. 1,
Funk et al, 2019) show that this CDR explains 23%, 40%, 30%, 41%, and 1% more variance than the CRU globally, and for South America, Africa, India, and areas north of 50°N, respectively; even greater levels of improvement are shown for the 2011–16 period (28%, 45%, 39%, 52%, and 28%, respectively).
The TIR Tmax algorithm used to generate this CDR makes use of the sub-daily TIR distributions to screen out cloud-contaminated observations, providing accurate (correlation ≈0.8) gridded emission Tmax estimates. Blending these gridded fields with 15,000 station observations provides a seamless, high-resolution source of accurate Tmax estimates that performs well in areas lacking dense in situ observations, and even better where in situ observations are available. Cross-validation results indicate that the satellite-only, station-only, and combined products all perform accurately (R ≈0.8–0.9, mean absolute errors ≈0.8–1.0). So, the Climate Hazards Center Infrared Temperature with Stations (CHIRTSmax) data set should serve as a valuable resource for climate change studies, climate extreme analyses, and early warning applications.
Key Takeaways
- CHIRTSmax is a global 2-m maximum temperature (Tmax) product that directly combines satellite and station-based estimates of Tmax to produce routinely updated data to support the monitoring of temperature extremes.
- The CHIRTSmax development process (Fig. 2) broadly follows the data development strategy used to develop our CHIRPS 1981-to-the present precipitation data set (Funk et al. 2015a). The basic idea behind CHIRPS was to produce a data set suitable for monitoring weather extremes in areas with limited in situ observations. The CHIRTsmax development process mainly includes three steps:
Step 1: Production of climatological mean monthly Tmax (CHTmax,clim)
For the CHIRTSmax long-term mean, we adopted a similar methodology to CHPclim. We build a high-resolution (0.05° latitude-longitude grid) global climatology, based on climate normals (long-term monthly means), physiographic indicators (latitude, longitude, and elevation), and monthly average MERRA-2 (Weller et al. 2016) 2-m maximum air temperature estimates. Rather than using the tridimensional ANUSPLIN approach used by the CRU, we use a newer technique—moving window regression Funk et al. 2015b)—which builds localized regressions between the long-term monthly means of a given station and our predictors: MERRA-2 means, elevation, latitude, and longitude. This process produces the monthly 0.05° Climate Hazards Center Tmax climatology (CHTclim).
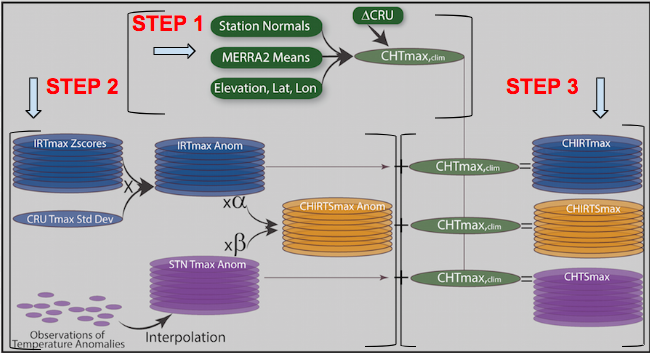
FIG. 2 Schema of CHIRTmax, CHIRTSmax, CHTSmax process. All data are at a monthly time scale. The gridded data use a common quasi-global 0.05° grid.
Step 2: Production of Tmax anomalies
Next, two different Tmax anomalies data sets were produced, one using IR observation, and another using station observations. For IR-based air Tmax anomalies, in each grid cell, if at least 10-daily non-cloudy CHIRTmax estimates were available, a monthly CHIRTmax was calculated from the average of these values. The 1983–2016 time period was then used to calculate monthly CHIRTmax climatologies (mean fields) and standard deviations. These values were used to translate the monthly varying CHIRTmax values into standardized anomalies (Z-scores). Anomaly fields were then estimated and translated into estimates of 2-m maximum air temperatures. For each month, this translation was achieved by multiplying CHIRTmax Z-scores by the local 1983–2016 standard deviation of the gridded CRU Tmax product. These monthly standardized deviations were calculated at the native CRU resolution (0.5) and then resampled to a 0.05 resolution.
For station-based estimates of air Tmax anomalies, Berkeley-GTS station data were used. For each month, candidate Berkeley-GTS station data locations were derived by identifying stations with at least seven observations over the 14 years between 2003 and 2016. Additional tests were also developed through statistical and visual analysis of the Berkeley-GTS station data, details of which can be found in Funk et al., 2019. Values were selected that removed obviously bad data but left as much station coverage as possible. For the screened stations, monthly Tmax values were translated into anomalies by subtracting the 2003–16 median from each time series. Additional filtering was used to identify and remove potential erroneous extremes. A spherically correct spatial interpolation toolkit (Spherekit) was used to interpolate the monthly station anomalies using an inverse distance weighted (IDW) technique, with an angular correction to reduce the influence of clustered station observations. Spherekit uses direction cosines to calculate correct geospatial Earth distances. This algorithm is similar to the commonly used Spheremap procedure.
Step 3: Blending of climatological normal and Tmax anomalies with stations
Finally, the CHTclim (Step 1), is combined with two independent sets of 2-m Tmax air temperature anomalies (Step 2) to produce the three different sets of Tmax estimates: satellite-only CHIRTmax, station-only CHTSmax, and blended satellite–station CHIRTSmax. While we anticipate that many users will be primarily interested in CHIRTSmax, the station and satellite-only products allow for independent analysis of extremes.
CHIRTSmax in Action
Data Access
Citations
Funk C., Peterson P., Landsfeld M., Pedreros D., Verdin J., Shukla S., Husak G., Rowland J., Hoell A. and Michaelsen J. (2015a) The climate hazards group infrared precipitation with stations - a new environmental record for monitoring extremes, Scientific Data, 22, 150066.
http://www.nature.com/articles/sdata201566
Funk, C., Verdin, A., Michaelsen, J., Peterson, P., Pedreros, D., and Husak, G.: A global satellite-assisted precipitation climatology, Earth Syst. Sci. Data, 7, 275-287,
https://doi.org/10.5194/essd-7-275-2015, 2015.
Funk, C., P. Peterson, S. Peterson, S. Shukla, F. Davenport, J. Michaelsen, K.R. Knapp, M. Landsfeld, G. Husak, L. Harrison, J. Rowland, M. Budde, A. Meiburg, T. Dinku, D. Pedreros, and N. Mata, 2019: A High-Resolution 1983–2016 Tmax Climate Data Record Based on Infrared Temperatures and Stations by the Climate Hazard Center. J. Climate, 32, 5639–5658,
https://journals.ametsoc.org/doi/pdf/10.1175/JCLI-D-18-0698.1