To receive updates on CHIRTS products, please provide your contact information here.
Data Access
CHC Website: Download CHIRTS-daily data
Earth Engine Data Catalog: Download CHIRTS-daily data
Introduction to CHIRTS-daily
Assessing weather-related hazards in a changing climate requires data sets that have accurate high-resolution spatial mean fields, good performance in data-sparse regions, and limited sources of non-stationary errors. High-resolution mean fields are important because impacts on health, agriculture, and other sectors are always local and typically non-linear. Impacts on humans or crops will be related to extremes in specific locations, and these impacts will often be strongly related to the variations in the absolute value of the weather variable under consideration. At present, there is a dearth of accurate information supporting the monitoring and evaluation of extreme temperatures in many food-insecure regions. Such extremes can wilt crops or decimate livestock herds, setting the stage for famine. Yet our ability to track these extremes in countries without weather station observations remains very limited.
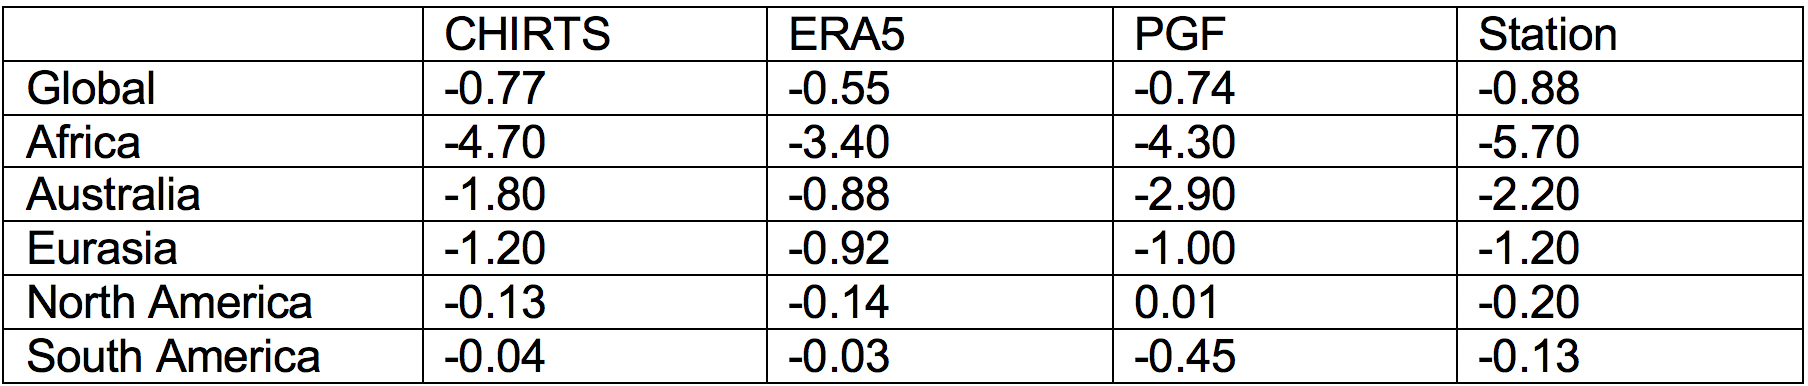
To address this limitation, the Climate Hazards Center (CHC) has developed a quasi-global (60°S – 70°N), high-resolution (0.05° x 0.05°, approx. 5km) data set of daily maximum and minimum temperatures, which we refer to as CHIRTS-daily (Verdin et al. 2020). The CHIRTS-daily development and validation process is outlined in Figure 1. Briefly, the monthly fields from the CHIRTSmax1 data series are temporally disaggregated using downscaled fields from version 5 of the European Centre for Medium-Range Weather Forecasts Reanalysis (ERA5; 3,4). The ERA5 has been shown to have robust performance with respect to spatial covariance and daily anomalies. However, ERA5 shows significant cool bias globally, and most notably in Africa. This cool bias in turn results in ERA5 underrepresenting the number of extreme hot days globally, and most notably in Africa. Figure 2 quantifies the representation of hot days for ERA5, CHIRTS-daily, Princeton’s Global Meteorological Forcing dataset (PGF), and stations from the ~15,000 Berkeley Earth database. Table 1 quantifies the difference in mean number of hot days between 2007-2016 and 1983-1992 for these products.
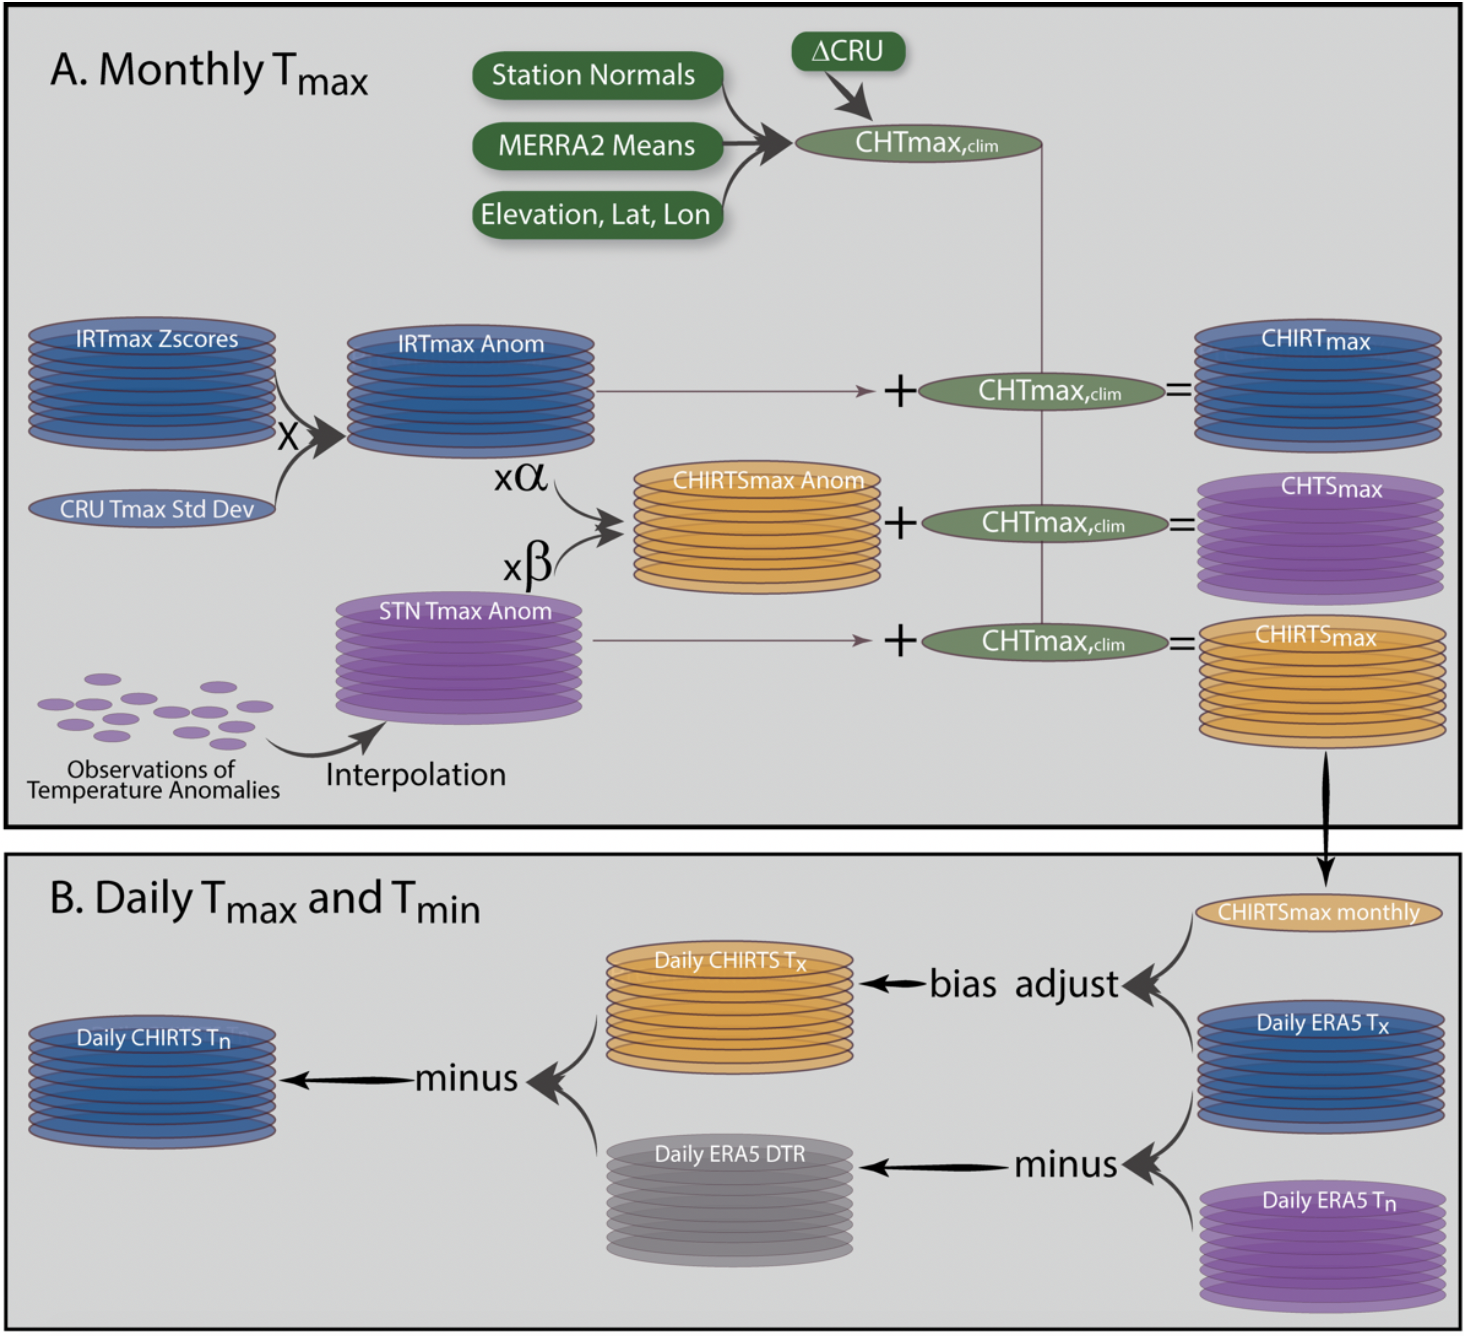
Figure 1. Description of the CHIRTS-daily development and validation processes. A. Description of the CHIRTSmax monthly Tmax development and validation processes. B. Schema of CHIRTS-daily Tmax (Tx) and Tmin (Tn) development process.
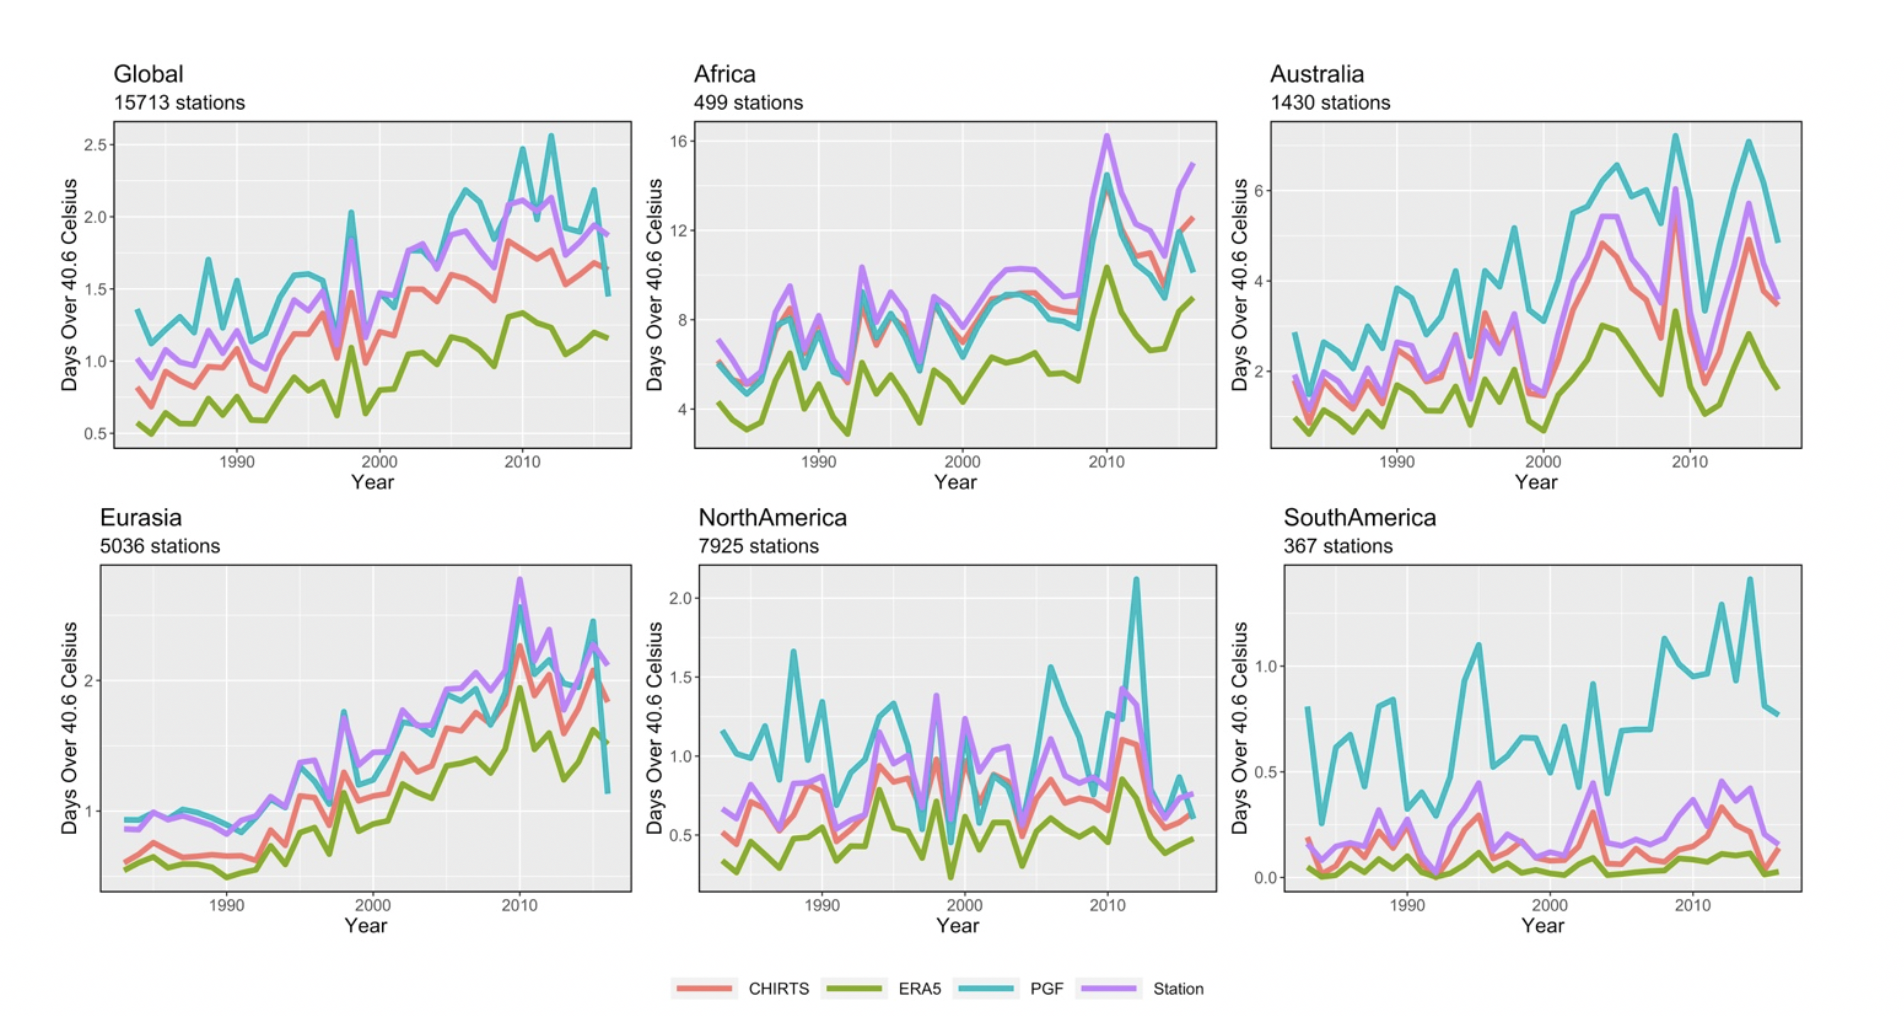
Figure 2. Average number of hot days (over 40.6°C) per year, as represented by CHIRTS-daily (red), ERA5 (green), PGF (blue), and the stations in the Berkeley Earth database (purple). Plots were generated for all stations (Global), and continents/regions Africa, Australia, Eurasia, North America, and South America.
Table 1. Difference in mean number of hot days (over 40.6°C) between 2007-2016 and 1983-1992.
Key Takeaways
• CHIRTS-daily is a global 2-m maximum temperature (Tmax) product that combines the monthly CHIRTSmax data set with the ERA5 reanalysis to produce routinely updated data to support the monitoring of temperature extremes.
Downscaling
Step 1: Downscaling ERA5 to CHIRTSmax resolution
Daily temperatures from the ERA5 are critical to developing the CHIRTS-daily products, as they define the relative evolution of daily temperatures within a given month. The most apparent limitation to using the ERA5 simulations in tandem with CHIRTSmax is the difference in spatial scales between the data products. The spatial scale of CHIRTSmax is approximately 5km by 5km (0.05°x0.05°), while that of ERA5 is approximately 25km by 25km (0.25° x 0.25°). To bridge this gap and facilitate the merging of the two data products, the ERA5 simulations are downscaled using bilinear interpolation in the Interactive Data Language (IDL) using the CONGRID command. Maximum and minimum temperatures for each day are treated independently in the downscaling procedure. Additionally, there is no explicit treatment of day-to-day temporal dependence. We assume that the inherent temporal autocorrelation is captured by the ERA5 simulations and is preserved in the downscaling routine. We also assume the dependence between maximum and minimum temperatures on a given day is preserved in the downscaling process. Ultimately, the decision to use the ERA5 simulations to disaggregate the monthly CHIRTSmax to daily scale is motivated by the latency of the product. A rapid monitoring version of the CHIRTS-daily product, which also uses ERA5 data and is produced using similar methods, is currently operational. The CHIRTS-ERA5 dataset provides an important source of information for tracking recent extreme temperature conditions (6 day latency). Extreme temperatures pose risks to the health of humans, wildlife, livestock, and crops, and can set the stage for intense wildfires and ecological damage.
Step 2: Production of the CHIRTS-daily Tmax and Tmin
To produce the CHIRTS-daily Tmax (CHIRTSX) values, the downscaled ERA5 Tmax are first translated into anomalies from the monthly ERA5 Tmax average. These daily Tmax anomalies are then added to each month’s CHIRTSmax 0.05° estimate. The resulting CHIRTSX product thus varies on monthly timescales with the CHIRTSmax while tracking the day-to-day variations of the ERA5 reanalysis. The ERA5 Tmax and Tmin are then used to determine the daily diurnal temperature range (DTR) at each 0.05° pixel. DTR is then used to produce CHIRTS-daily Tmin (CHIRTSN) by subtracting the DTR from CHIRTSX.
The steps taken to produce the CHIRTS-daily temperature fields are summarized as follows.
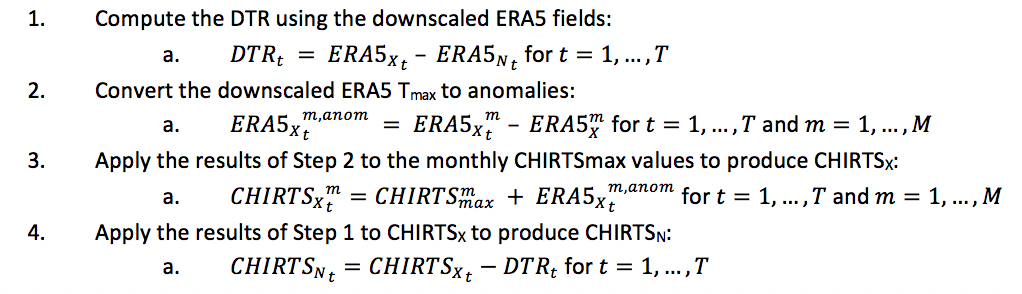
In the above equations, T represents the total number of days in the CHIRTS-daily data record, where (1, 2, 3, ..., T-2, T-1, T) represents (Jan 1 1983, Jan 2 1983, Jan 3 1983, …, Dec 29 2016, Dec 30 2016, Dec 31 2016); M represents the total number of months in the CHIRTSmax data record, where (1, 2, 3, …, M-2, M-1, M) represents (Jan 1983, Feb 1983, Mar 1983, … Oct 2016, Nov 2016, Dec 2016).
Citations
1. Verdin, A., C. Funk, P. Peterson, M. Landsfeld, C. Tuholske, and Grace, K., 2020: Development and validation of the CHIRTS-daily quasi-global high-resolution daily temperature data set. Scientific Data, 7(1), 303. https://doi.org/10.1038/
2. Funk, C., P. Peterson, S. Peterson, S. Shukla, F. Davenport, J. Michaelsen, K.R. Knapp, M. Landsfeld, G. Husak, L. Harrison, J. Rowland, M. Budde, A. Meiburg, T. Dinku, D. Pedreros, and N. Mata, 2019: A High-Resolution 1983–2016 Tmax Climate Data Record Based on Infrared Temperatures and Stations by the Climate Hazard Center. J. Climate, 32, 5639–5658, https://journals.ametsoc.org/
3. Copernicus Climate Change Service (C3S) (2017): ERA5: Fifth generation of ECMWF atmospheric reanalysis of the global climate
4. Copernicus Climate Change Service Climate Data Store (CDS), accessed 03/11/2020. https://cds.climate.copernicus.eu/cdsapp#!/home

To the extent possible under law, Chris Funk has waived all copyright and related or neighboring rights to CHIRTS-daily. This work is published from: United States.