Data Overview
Assessing weather-related hazards in a changing climate requires data sets that have accurate high-resolution spatial mean fields, good performance in data-sparse regions, and limited sources of non-stationary errors. At present, there is a dearth of accurate information supporting the monitoring and evaluation of extreme temperatures in many food insecure regions. Such extremes can wilt crops or decimate livestock herds, which can have lasting negative impacts on livelihoods. Locating heat extremes is important for understanding impacts and identifying solutions. Yet our ability to track these extremes in countries with sparse weather station observations remains very limited.
Data Access and Formats
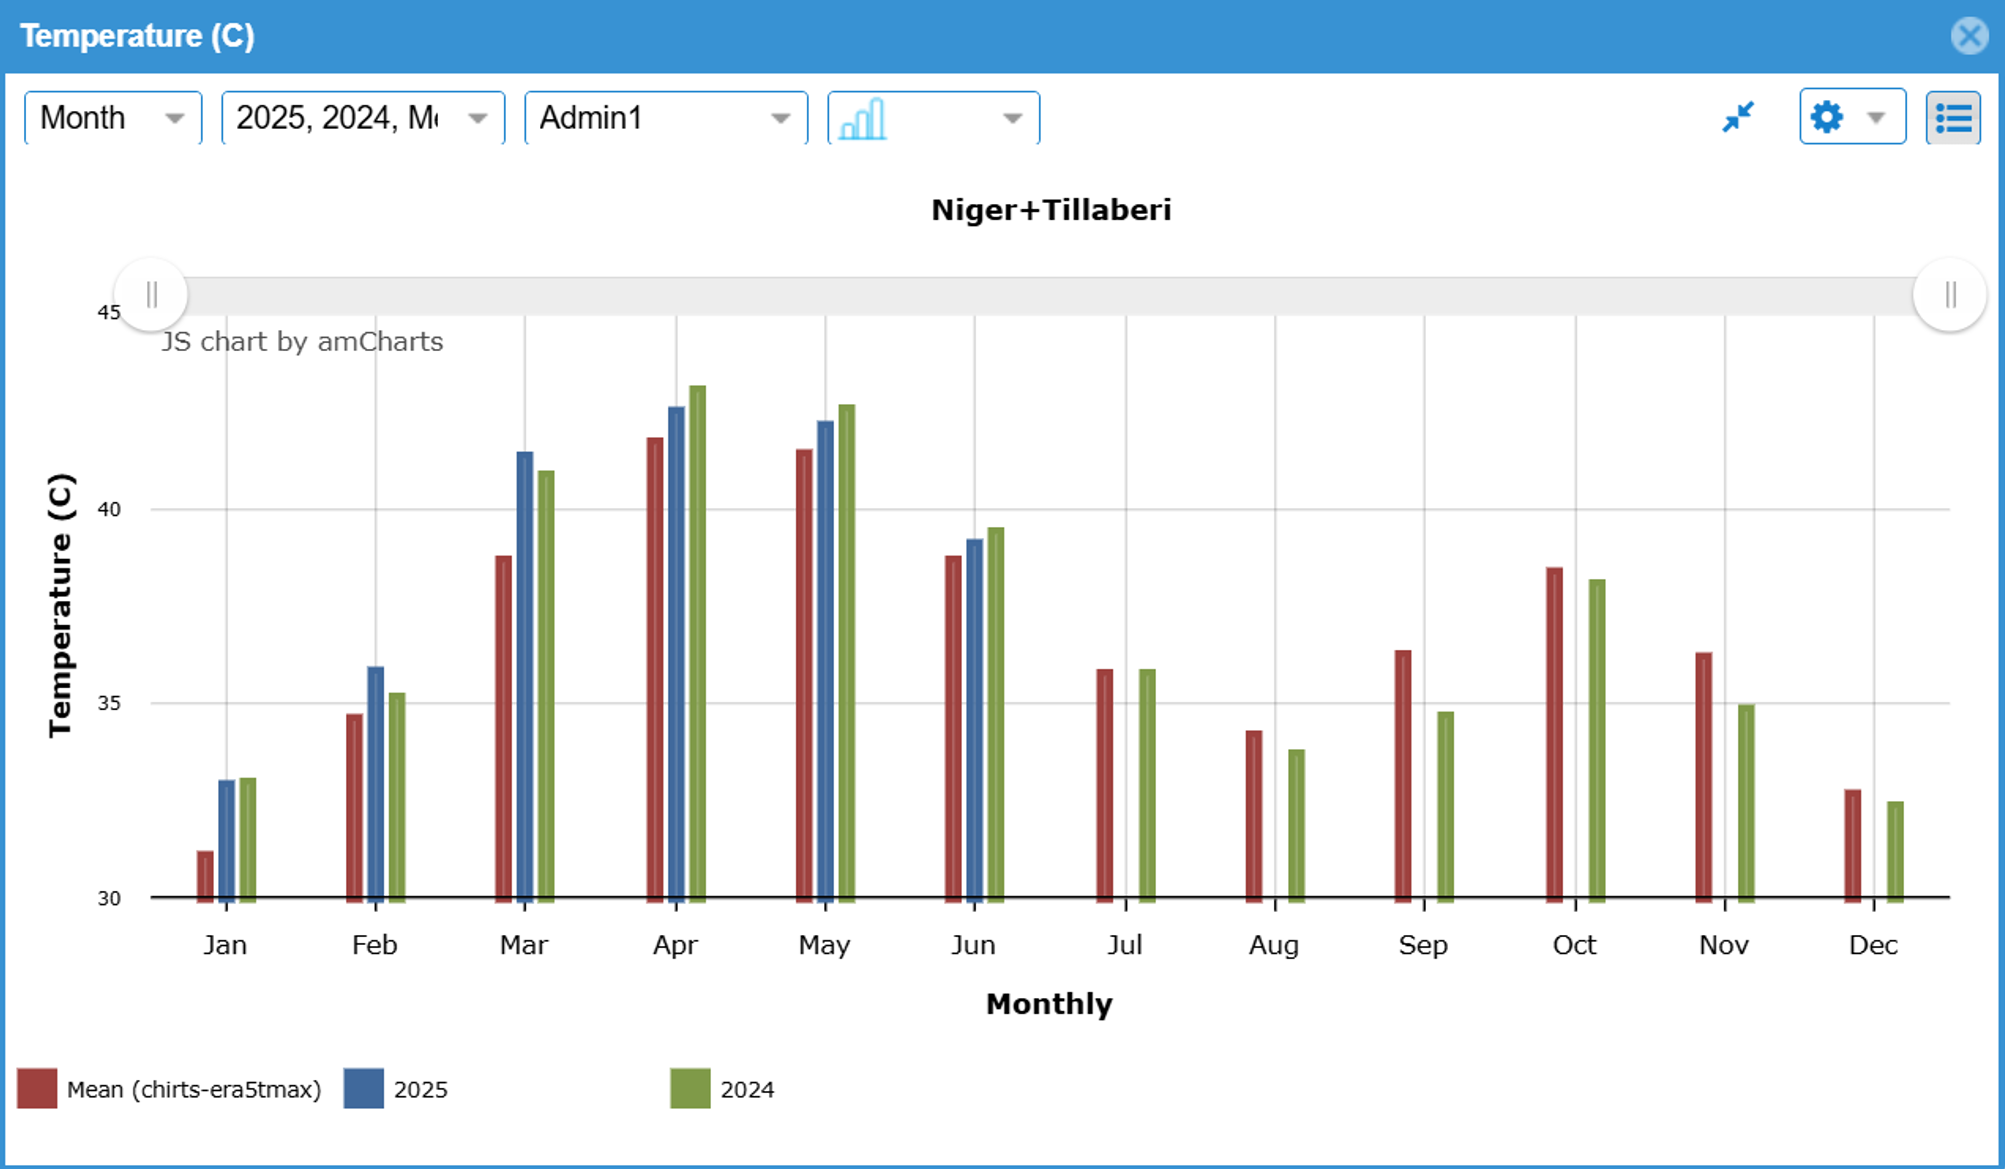
Figure 1. Time series of CHIRTS-ERA5 maximum temperature in Tillaberi, Niger extracted from the Early Warning Explorer
A. CHIRTS-ERA5 Tmax and Tmin
Step 1: Downscaling ERA5 to CHIRTSmax resolution
Daily temperatures from the ERA5 are critical to developing the CHIRTS-ERA5 daily products, as they define the relative evolution of daily temperatures within a given month. The CHIRTS-ERA5 daily temperature product combines daily ERA5 2-m temperatures with the CHIRTS climatology to generate daily maximum (Tmax) and minimum (Tmin) fields at 0.05°. The most apparent limitation to using the ERA5 simulations in tandem with CHIRTS products is the difference in spatial scales between the datasets. The spatial scale of CHIRTSmax is approximately 5km by 5km (0.05°x0.05°), while that of ERA5 is approximately 25km by 25km (0.25° x 0.25°). To bridge this gap and facilitate the merging of the two data products, the ERA5 simulations are downscaled using bilinear interpolation from CDO. Maximum and minimum temperatures for each day are treated independently in the downscaling procedure. Additionally, there is no explicit treatment of day-to-day temporal dependence. We assume that the inherent temporal autocorrelation is captured by the ERA5 simulations and is preserved in the downscaling routine. We also assume the dependence between maximum and minimum temperatures on a given day is preserved in the downscaling process.

Figure 2. Description of the CHIRTS-ERA5 development process
Step 2: Production of the daily Tmax and Tmin values
Daily CHIRTS-ERA5 Tmax values are derived by computing a correction factor that identifies how different the ERA5 Tmax was for that day, compared to the average (1983-2016) value for that month. The correction factor is then standardized and made compatible with CHIRTS monthly values and added to the CHIRTSmax monthly mean to produce bias-adjusted daily Tmax estimates.
Daily CHIRTS-ERA5 Tmin values are subsequently generated from the CHIRTS-ERA5 Tmax. First the ERA5 Tmax and Tmin are used to calculate the ERA5 diurnal temperature range (DTR) at each 0.05 pixel. DTR is then used to produce CHIRTS daily Tmin by subtracting the DTR from CHIRTS-ERA5 Tmax.
The daily CHIRTS-ERA5 Tmax and Tmin values are computed using daily ERA5. The monthly CHIRTS-ERA5 Tmax and Tmin values are computed using the monthly means of daily ERA5 values as the input into the bias correction process.
B. CHIRTS-ERA5 Heat Index (HI) and Wet Bulb Globe Temperature (WBGT)
To generate daily Heat Index and Wet Bulb Globe Temperature (WBGT) estimates, the hour of day when ERA5 2-meter Tmax peaks is first identified. The corresponding 2-meter dewpoint temperature (Td) at that hour is retained for use in daily calculations. These values are regridded from 0.25° to 0.05° resolution using bilinear interpolation (CONGRID in IDL).
Using the CHIRTS-ERA5 Tmax, saturation vapor pressure (SVP) is computed and combined with the Td-derived actual vapor pressure (AVP) to calculate daily maximum Relative Humidity (RH). Using the calculated RH and CHIRTS-ERA5 Tmax, daily Heat Index values are computed and are subsequently used to estimate the WBGT.
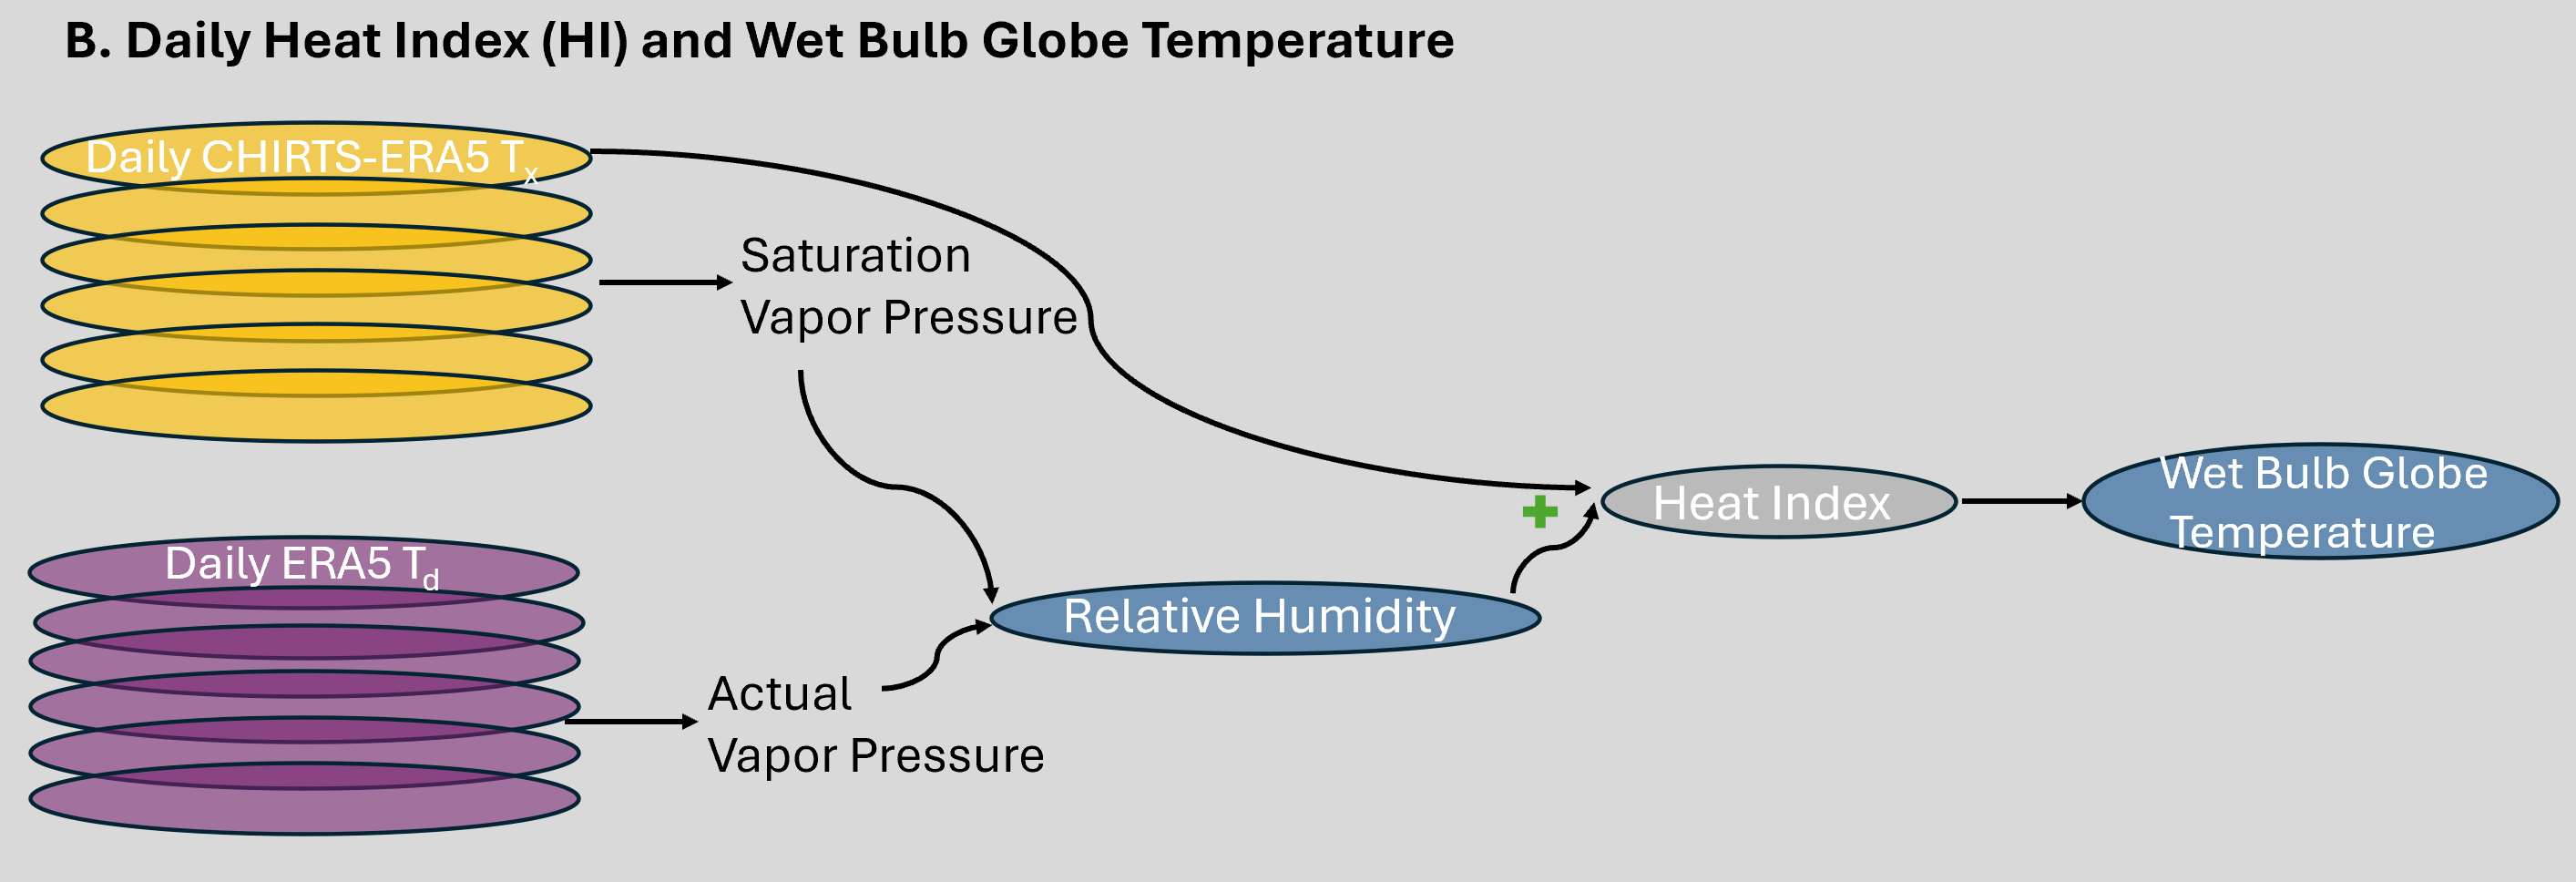
Figure 3. Description of the CHIRTS-ERA5 Heat Index and Wet Bulb Globe Temperature development process
CHC Heat Monitor
Extreme temperature anomalies can significantly impact human health, livelihoods, and agricultural productivity. Monitoring these extremes is essential for anticipating risks and guiding early action. The CHC Heat Monitor leverages the CHIRTS-ERA5 temperature dataset to identify regions where daily maximum temperatures exceed the 80th percentile of the historical distribution. Using this approach, the Heat Monitor generates a range of temperature anomaly maps, including global, regional, and AgriHeat products that highlight hotspots of potential concern.

Figure 4. CHIRTS-ERA5 daily maximum temperature anomaly summary for East Africa in 2025. Panels show: (top-left) average Tmax anomaly relative to the 1983–2016 climatology; (top-middle) average daily maximum temperature; (top-right) maximum temperature recorded on the hottest day; (bottom-left) total number of hot days (Tmax > 35°C); (bottom-middle) average number of hot days; and (bottom-right) 2025 hot day frequency expressed as a ratio compared to the climatological average. This regional summary highlights both the intensity and persistence of heat across the region.
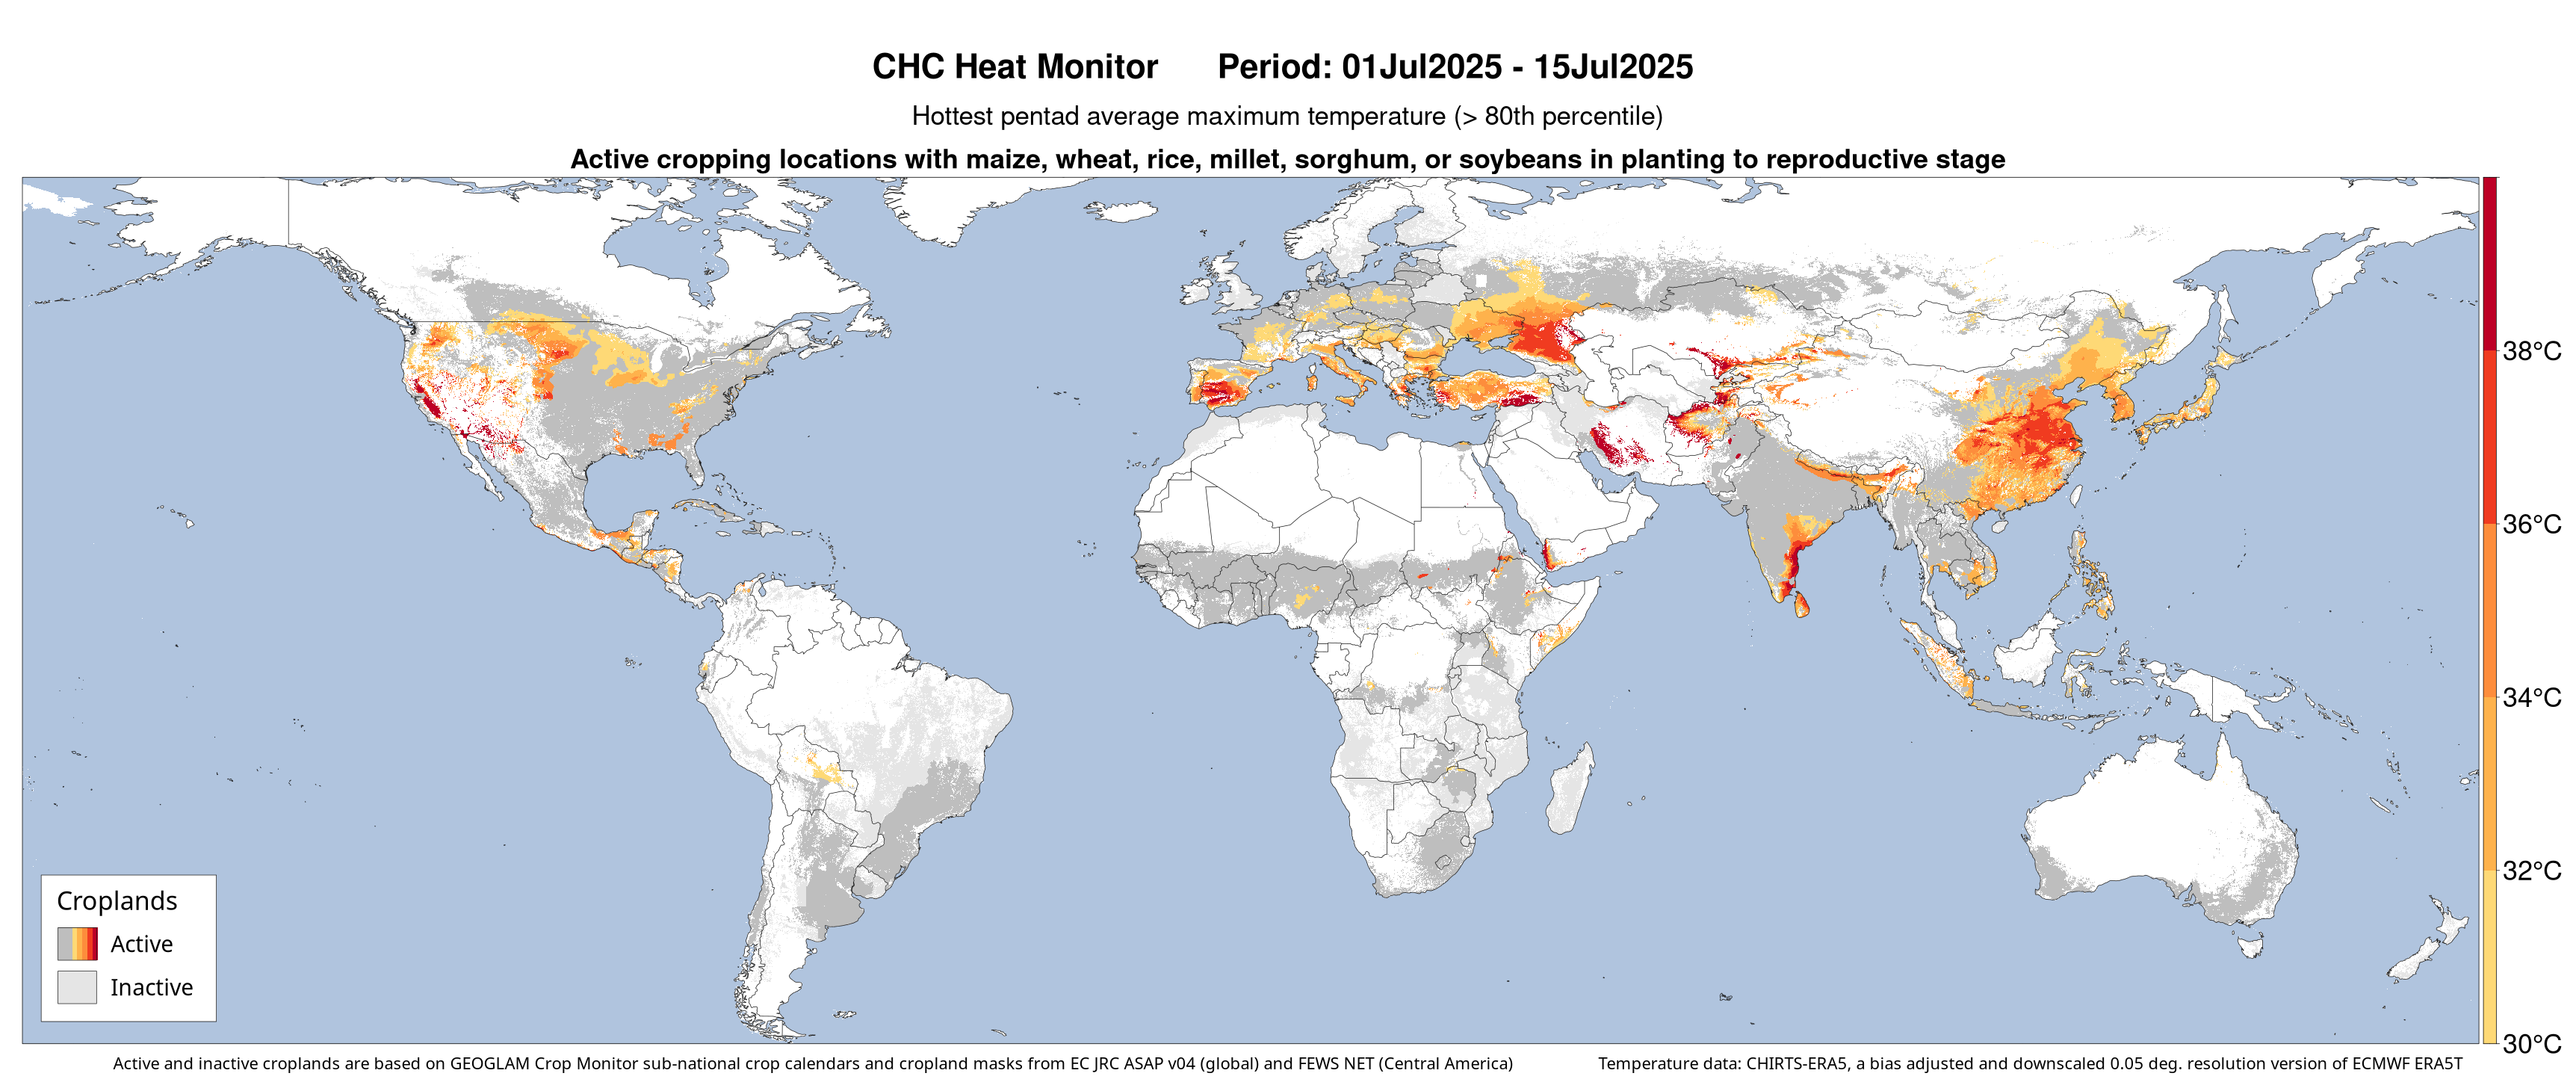
Figure 5. CHC Heat Monitor showing active cropping zones where CHIRTS-ERA5 maximum temperatures exceeded the 80th percentile threshold over three consecutive pentads (15-day period). These AgriHeat maps help pinpoint areas experiencing persistent heat stress during crop development, supporting early warning efforts and food security analysis.
CHIRTS-ERA5 Heat Monitor is regularly used in the monthly GEOGLAM Crop Monitor for Early Warning Reports, a global initiative that provides timely, science-based assessments of crop conditions in countries at risk of food insecurity. Within these reports, the CHC Heat Monitor helps identify agricultural regions experiencing extreme temperature anomalies that can negatively impact crop development, reduce yields, and exacerbate existing vulnerabilities.
- Copernicus Climate Change Service (C3S) (2017): ERA5: Fifth generation of ECMWF atmospheric reanalysis of the global climate.
- Copernicus Climate Change Service Climate Data Store (CDS), accessed 03/11/2020. https://cds.climate.copernicus.eu/cdsapp#!/home
- Verdin, A., Funk, C., Peterson, P., Landsfeld, M., Tuholske, C., & Grace, K. (2020). Development and validation of the CHIRTS-daily quasi-global high-resolution daily temperature data set. Scientific Data, 7(1), 303.
- Funk, C., Peterson, P., Peterson, S., Shukla, S., Davenport, F., Michaelsen, J., ... & Mata, N. (2019). A high-resolution 1983–2016 Tmax climate data record based on infrared temperatures and stations by the Climate Hazard Center. Journal of Climate, 32(17), 5639–5658.
How to cite this data
Please cite CHIRTS-ERA5 data as: CHIRTS-ERA5 Data Repository https://doi.org/10.15780/G2F08J (2025). Data was accessed on [DATE].

CHIRTS-ERA5 is in the public domain, as registered with Creative Commons, and is under a Creative Commons Attribution 4.0 International License. To the extent possible under the law, the Climate Hazards Center has waived all copyright and related or neighboring rights to CHIRTS-ERA5. This work is published from: the United States.